HTTP/HTTPS monitor tests the availability of the server to handle requests and calculates the connection time.
Configuration Parameters
Before you create the monitor, enable the synthetic agent flag in Setup > Resources > Management Profile > Management Gateways > Synthetic. This flag is used to show your private locations.
After selecting the synthetic monitor type to FTP, enter the follwoing details in FTP CONFIGURATION screen:
| Section | Field Name | Description | Values/Example | Field Type |
|---|---|---|---|---|
| Basic Details | Name | Enter a name for the synthetic monitor. | Text | |
| Type | Select the type of synthetic monitor. | HTTP/HTTPS | Dropdown | |
| HTTP/HTTPS Configuration | URL | Enter the URL to be monitored. | https://www.google.com/ | Text |
| Connection Timeout | Maximum time-out required to connect to the given website. |
| String | |
| Should Contain | Response body should contain specific content. Check the presence of any text in the response of the URL. |
| Text | |
| Should Not Contain | Response body should not contain specific content. Check the absence of any text string in the response of the URL. |
| Text | |
| Expected Response Code | The response code returned from the end server should be one from the mentioned response codes (which is in csv format). |
| Text | |
| Payload Regular Expression | Create Regex Patterns to validate the HTTP Response body received from the webserver. |
| Text | |
| Http Headers | HTTP headers |
| Text | |
| Http Params | HTTP parameters |
| Text | |
| Method | Type of method to execute while monitoring the website. |
| Dropdown | |
| Assign Credentials | Credential Set | Select the credentials to access the FTP Server from the dropdown list. | Dropdown | |
| Proxy Settings | Configuration Type | Enable Proxy Configuration option and select the configuration type.
| Checkbox | |
| Upload/Download | File upload options | Select an option to upload or download a file:
| Checkbox | |
| Locations | Public Locations | Select the public locations where the monitor will run. | INT Public1 | Checkbox |
| Private Locations | Select the private locations where the monitor will run. | INT Private1 | Checkbox |
After configuring, view metrics, and graphical representations for more information.
Graphical Metrics Representation
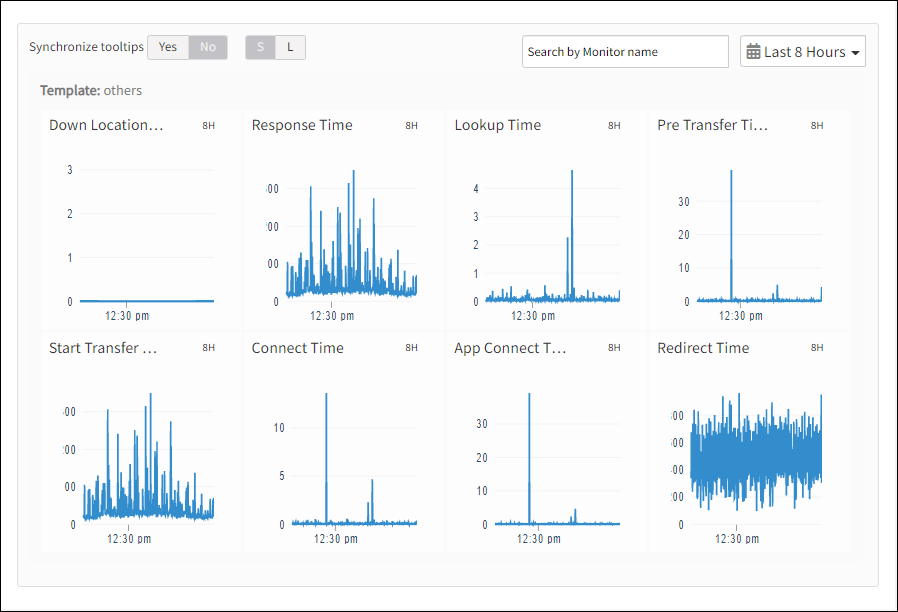
Supported Metrics
| Metric Name | Units |
|---|---|
| availability.down.location.count Location Count. The number of locations where the configured host is down | - |
| synthetic.response.time Response time. Duration to do the configured HTTP Method (GET, POST, PUT, HEAD) to specified URL | milliseconds |
| synthetic.response.lookuptime Name Lookup Time. Duration from the start until the DNS name is resolved | milliseconds |
| synthetic.response.connecttime Connection Time. Duration from the start until the web server is connected | milliseconds |
| synthetic.response.appconnecttime AppConnect Time. Duration from start until SSL/SSH handshake is completed | milliseconds |
| synthetic.response.starttransfertime Start TransferTime. Duration from start until just when the first byte is received | milliseconds |
| synthetic.response.redirecttime Redirect Time. Time taken for all redirect steps before the final transfer | milliseconds |
| synthetic.response.pretransfertime Pretransfer Time. Duration from the start until the file requested page transfer is about to start | milliseconds |